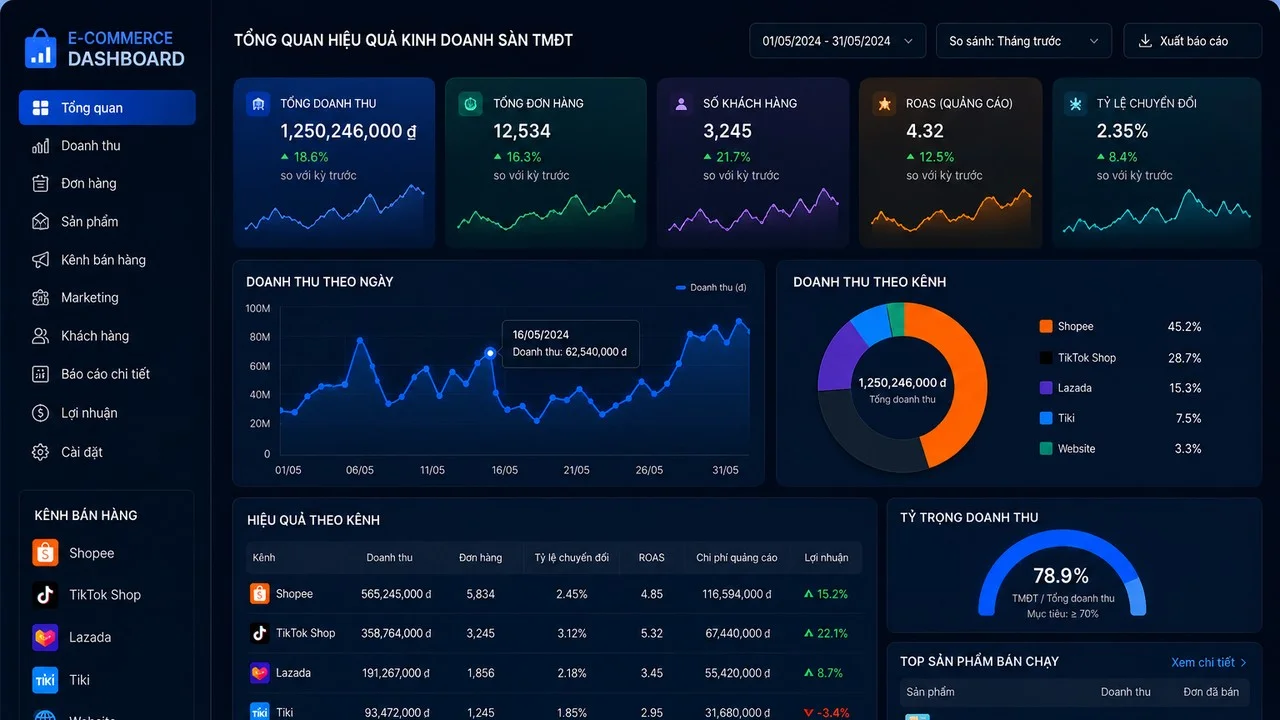
E‑commerce P&L Reporting Dashboard: four marketplaces on one screen
Four marketplaces, four report formats, and hours every week spent stitching data together by hand to answer one question that decides everything: which marketplace is actually making money? This is how I used AI to delete that manual step entirely.
RoleFraming the problem & designing the logic
StatusIn daily use
ToolsGoogle Antigravity · Claude Code · Codex
Core result~6 hrs/week saved P&L managed in near real time
01 · Problem
The data was all there, just fragmented and inconsistent
A matrix of reports: Shopee, TikTok Shop, Lazada and Tiki each have their own reporting system, with different structures, different names for the same metric and completely different fee schedules
Decisions arrived late: downloading, cleaning and joining files by hand in Excel took hours and invited mistakes at the reconciliation step. By the time the final number appeared, the window to act on the campaign had closed
Profit was a blur: costs could not be cleanly separated per marketplace — platform fees, ad spend, hidden charges — so ad budget was being allocated with no financial basis
02 · Solution
Automate with AI, break the P&L out accurately
My role was to set the brief and review the processing logic, using AI as the developer to generate the code that automates the whole data flow.
Extract: pull data from the marketplaces automatically via API, or read the raw report files
Normalise: bring the metric vocabulary of all four marketplaces onto one standard so they can be compared side by side
Calculate: deduct platform fees, shipping and ad spend automatically to reach net profit for each sales point
Visualise: push the numbers into dashboard charts so the financial picture reads in seconds
03 · How it runs
From raw data to chart
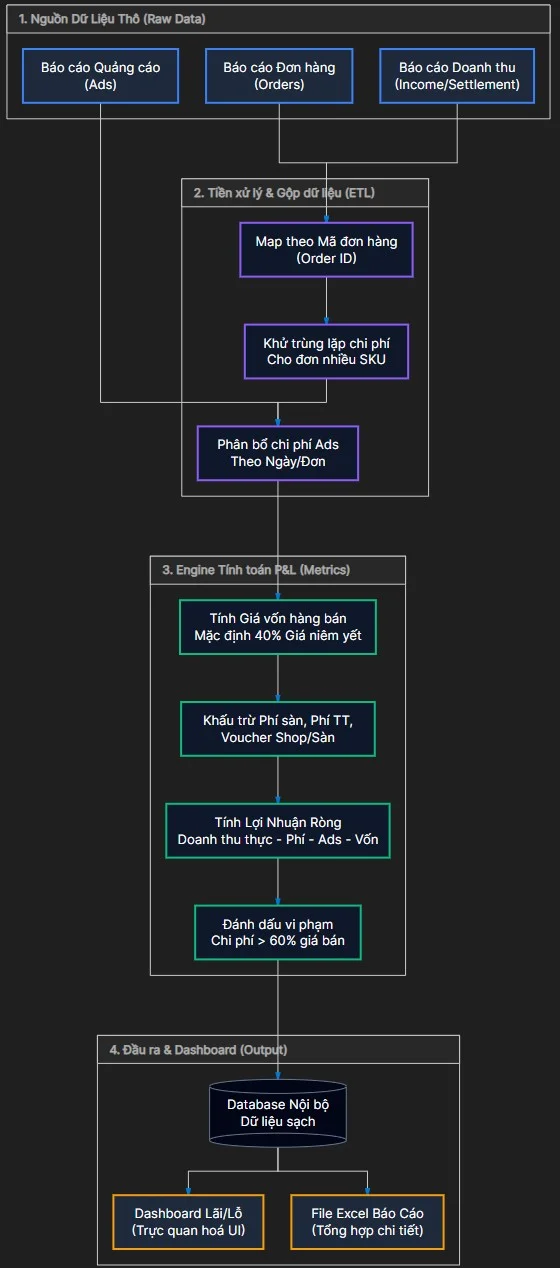
Raw sources: pull three report types from each marketplace at once — ads, orders, and income/settlement
Pre-processing and merge (ETL): map the three sources on order ID, remove duplicated costs on multi-SKU orders, then allocate ad spend down to the day and the individual order
P&L engine: compute cost of goods sold (default 40% of list price), deduct platform fees, payment fees and both shop and platform vouchers to reach net profit, and flag any order whose costs exceed 60% of its selling price
Output: write to a cleaned internal database, then publish in parallel to a visual profit-and-loss dashboard and a detailed Excel report
The four layers of the data flow, from raw marketplace reports to the P&L dashboard and the Excel file.
04 · Results
Decide on profit, not on surface revenue
~6 hours
Saved every week
4 marketplaces
Merged onto one screen
~10 minutes
From raw data to a finished report
Measure
Before the dashboard
After automation
Time to a report
~6 hours a week
~10 minutes from raw data
Scope of oversight
Each marketplace on its own
All four marketplaces on a single screen
Basis for decisions
Instinct, reading gross revenue
Precise, based on net profit
The real value: the payoff here is not the six hours freed up each week. It is the change in decision quality. Moving budget between marketplaces is now directed by the profit actually received, which ends the habit of burning money chasing revenue that was never really there.